

Power BI dashboards for Private Equity Portfolio Performance teams in Dubai
Operator-led reporting support for private equity portfolio performance teams across Dubai and the UAE that need clearer KPIs, less manual reporting, and numbers the business can trust.
Private Equity Portfolio Performance reporting in Dubai and the UAE
Private equity portfolio reporting needs a consistent way to compare entities, track initiatives, and surface operational variance without rebuilding every report manually.
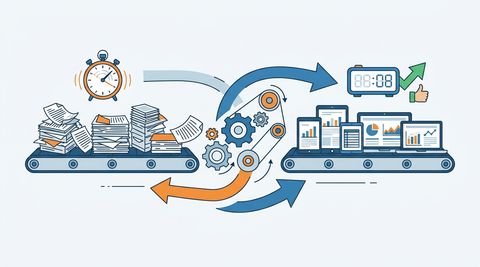
Revenue growth, days to close and gross margin are the figures a board actually asks about, and they are assembled from CRM platforms, Excel workbooks and Oracle. When that assembly is manual, the pack is accurate on the day it is built and stale by the time it is read, and any question that was not anticipated waits until next month.
We model those sources once so the definitions hold across finance, operations and leadership, and portfolio, investor, and executive teams can follow a number down to the transaction that caused it without commissioning a new report.
The meeting this is built for
The investment committee meeting. Each portfolio company reports in a different format. Some send spreadsheets, some send slide decks, some send nothing until chased. The investment team cannot compare entity performance on a like-for-like basis. This reporting is built so the committee sees revenue, EBITDA, cash, and initiative tracking across all portfolio companies - in a consistent, comparable format.
Who this reporting is built for
CEO / Managing Director
- Cares about
- a single trusted performance view
- Frustrated by
- different numbers from different department heads
- Needs to decide
- where to focus attention and investment
CFO / Finance Manager
- Cares about
- reliable financial and operational reporting
- Frustrated by
- manual reconciliation and workbook dependency
- Needs to decide
- budget, variance, margin, and cash actions
COO / Operations Manager
- Cares about
- operational performance connected to commercial outcomes
- Frustrated by
- late reporting and weak drill-down
- Needs to decide
- where process, labour, or service issues need intervention
Board and executive stakeholders
- Cares about
- concise, trusted reporting
- Frustrated by
- too much manual pack preparation and explanation
- Needs to decide
- how the business is really performing and where risk is building
What's going wrong now
Each department presents performance differently.
The board pack takes days to assemble from multiple sources.
Definitions change between reporting periods.
The executive team cannot self-serve without requesting analysis.
Financial and operational data never align on first review.
What changes after this is built
Common private equity portfolio performance reporting problems
SQL databases and SharePoint files each hold part of the same answer and disagree on the total
Board pack cycle time and data quality issues are calculated differently by finance and operations, and both are defended
Reporting still depends on Excel workbooks, manual checks and copied values
There is no clean single view by entity, business unit and portfolio
Review meetings lose time validating the data before the decision can start
KPI ownership arrives after the window in which anyone could have acted on it
Too much of the reporting lives with one person, or in one undocumented workbook
Existing Power BI reports are slow, stale, or quietly not trusted
Managers cannot drill into a number without asking someone to rebuild the report
Assembling private equity portfolio performance reporting takes longer than reviewing it does
Board and investor packs still depend on spreadsheet assembly
Leadership cannot move from the summary to the cause quickly enough
Book a reporting clarity call
You'll leave with a written action plan: speed issues, KPI drift, governance gaps, and a practical 30-day fix path.
Systems and data sources we connect
Reporting friction often starts because the right data sits across disconnected platforms. We connect the sources that matter for private equity portfolio performance reporting.
Core finance and planning systems
Commercial and operational inputs
Reporting data sources
What we build for private equity portfolio performance teams
Executive scorecards
A sharper leadership view across revenue, margin, cash, operational health, and accountability.
Board reporting packs
Reduce manual preparation and improve consistency across monthly and quarterly packs.
Financial and operational bridge reporting
Bring finance and operating drivers into one reliable view.
Entity, portfolio, or business unit comparison
Make it easier to compare performance on a like-for-like basis.
Forecast versus actual tracking
Expose variance sooner and improve management conversation quality.
KPI governance dashboards
Create a practical structure around definitions, ownership, and accountability.
Key private equity portfolio performance KPIs and decision metrics
Executive performance
- EBITDA
- gross margin
- cash flow
- budget variance
- working capital
- return on capital
Business drivers
- revenue growth
- customer retention
- pipeline value
- operating cost
- service performance
- forecast accuracy
Governance and control
- days to close
- board pack cycle time
- data quality issues
- KPI ownership
- overdue actions
- risk indicators
What becomes easier after implementation
The value is not only in the dashboard or the data model. It is in what changes day to day once reporting stops being a source of friction.
Why Oakwood Group for private equity portfolio performance reporting
Private equity portfolio reporting needs a consistent way to compare entities, track initiatives, and surface operational variance without rebuilding every report manually.
That is the environment the reporting has to survive, so we build it around how portfolio, investor, and executive teams actually work - what gets asked in the meeting, what has to reconcile, and what breaks when one person is on leave.
We serve Dubai and the UAE remotely in Gulf Standard Time hours, in partnership with Roar Data, an Australian Power BI consultancy. For private equity portfolio performance that matters less for proximity than for availability: someone who will join the review where the numbers get argued about, rather than only the handover.
The test is whether the reporting still gets opened six months later without us. If it needs a specialist to maintain, it was built wrong.
Private Equity Portfolio Performance reporting FAQs
Which systems can you connect Power BI to for private equity portfolio performance reporting?
Which private equity portfolio performance reporting metrics do you model first?
Can you fix an existing private equity portfolio performance Power BI setup rather than rebuild it?
Can you report across multiple business units?
Do you need to understand private equity portfolio performance reporting to build it?
Talk through your private equity portfolio performance reporting
If your reporting still depends on manual work, spreadsheet fixes, or numbers people do not fully trust, we can map out a practical way forward.
Our services
Power BI Consulting
Oakwood Group helps Australian organisations eliminate spreadsheet reporting, unify fragmented systems and deliver real-time executive, financial and operational dashboards using Microsoft Power BI.
Explore servicePower BI Managed Services
Ensure your dashboards stay accurate, secure and performance-ready with proactive Power BI monitoring, optimisation and continuous improvement.
Explore servicePower BI Training Dubai
Practical Power BI training for Dubai and UAE teams that need reports to be maintainable, commercially useful, and easier to run day to day.
Explore serviceOther industries
Manufacturing
Manufacturing businesses across Dubai and the wider UAE often juggle ERP data, production systems, maintenance logs, quality records, and spreadsheet-based shift reporting across multiple teams. We help turn that fragmented reporting environment into something leadership and managers can use with more confidence.
Explore industryPharmaceuticals
Pharmaceutical reporting usually spans batch records, QA systems, validation documentation, ERP data, and finance reporting, with a high need for traceability and disciplined KPI definitions. We help turn that fragmented reporting environment into something leadership and managers can use with more confidence.
Explore industryFMCG & Consumer Goods
FMCG businesses producing and trading through the UAE need fast visibility across sales, inventory, production, distribution, and margin without waiting for month-end clean-up. We help turn that fragmented reporting environment into something leadership and managers can use with more confidence.
Explore industryAgriculture
Agriculture and agri-food reporting across the Emirates often spans sites, seasons, suppliers, logistics, and operational logs that are not naturally in one clean reporting structure. We help turn that fragmented reporting environment into something leadership and managers can use with more confidence.
Explore industry